DLXVG3's graphs can be customized in many different ways. Here we explore some basic functions and options to customize your graph.
Let's continue using the data series from the section Browse for a Data Series:
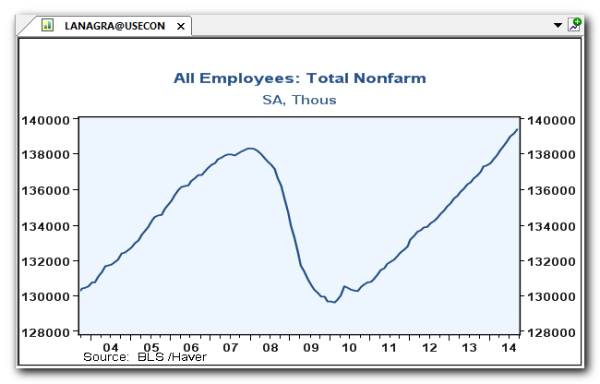
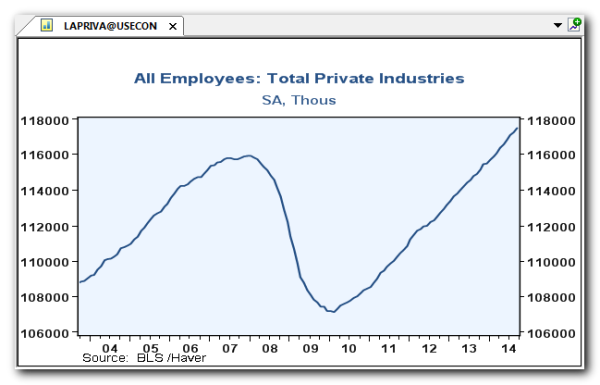
- Set a zoom
- The zoom function is used to modify the number of periods shown on the x-axis of the graph.
- Select
 in the toolbar and enter the desired number of years, for example, 20 years:
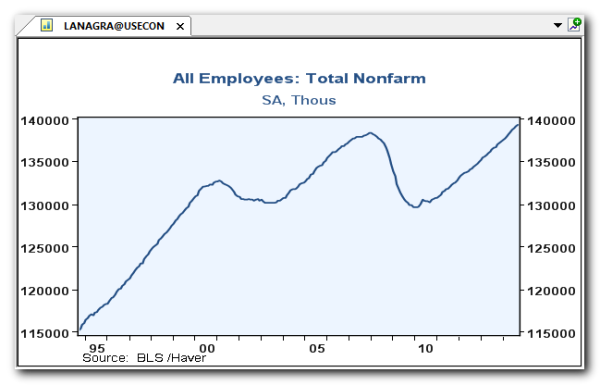
 - Apply recession shading
- Select
 in the toolbar.
 - Apply a basic function
- Select
 in the toolbar.
 - Add a variable
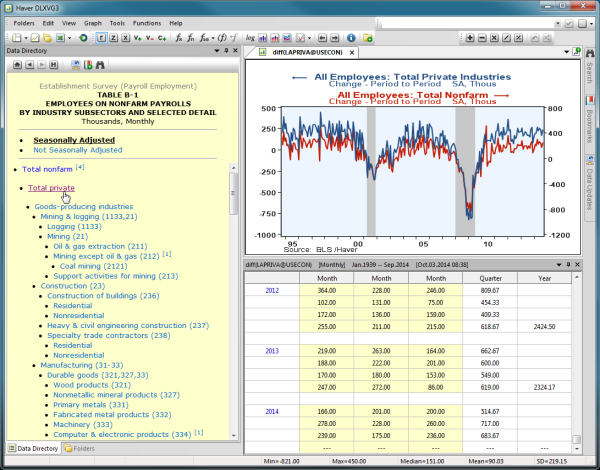
- To view multiple series on a graph, add a variable and select a new series.
- Select
 in the toolbar.
 - Select Total Private as illustrated below:
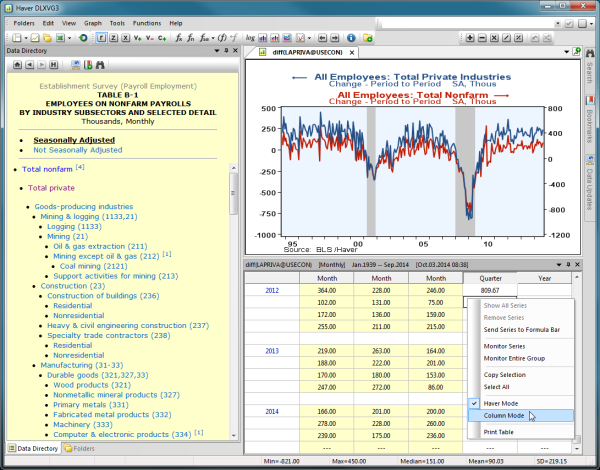
- The data table is displayed in Haver Mode by default. This can be changed to Column Mode by right clicking on the data table:
- Reset graph settings
- To restore the graph to its original settings select
 in the toolbar:
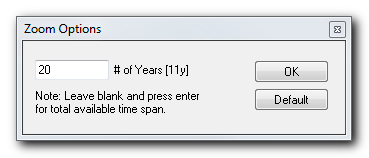
 The number shown in the brackets represents the current selection.
Notice that the graph now displays 20 years of data:
See Zoom for more information.
The default recession shading is set to USA. However, the default can be changed to another country or to a custom recession.
See Recession Shading for more information.
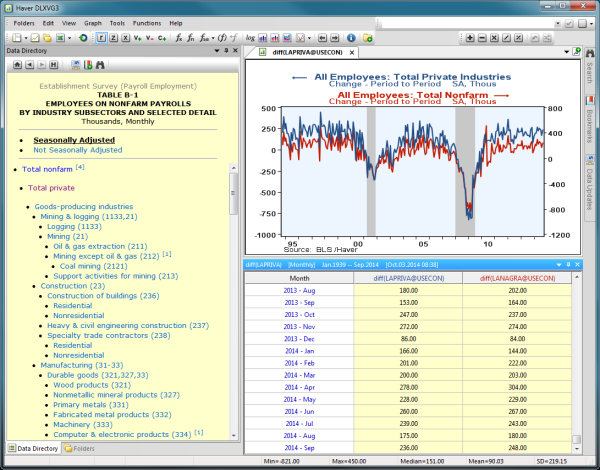
For example, apply a "period to period difference" function to this series by selecting option 5 from the menu below:
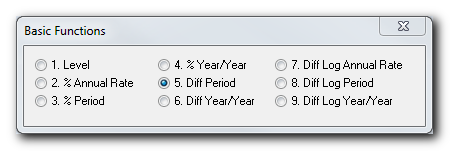
The series is now displayed with the "diff period" function applied. In this example, we have calculated the number of jobs created each month.
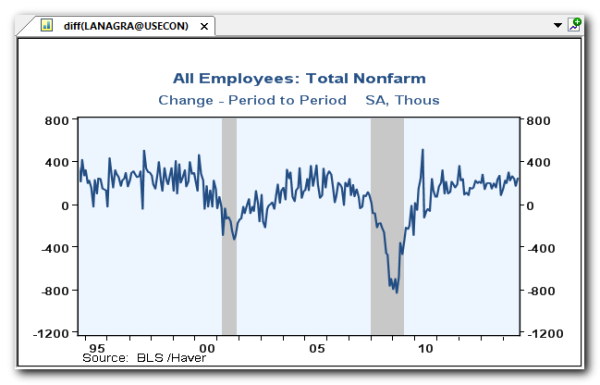
See Functions for more information.
See Variables and Constants and Data Tables for more information.
This will restore the original settings for the primary series, which in this case is LAPRIVA@USECON and remove all other series from the graph, in this case LANAGRA@USECON
The primary series/active series/active variable is the series listed first.