What is a variable?
- A Data Series
- A Constant
- A Trend Line
Variables can turn into new variables with manipulation from mathematical operations and/or functions.
Up to 8 variables can be displayed in a graph. When a new variable is inserted to a graph, it becomes the active seriesThe first variable listed on a graph; all operations/functions will be applied to this series.. The active series will:
- Display its code in the graph tab
- Have its title listed first
- Have its code listed in the title bar of the data table
- Display its values in Haver Mode or reside in the leftmost column in Column Mode
- Control the left Y-axis scale
Add a data series
- To add another series to the graph, do one of the following:
- Click add variable
 from the Graph Settings toolbar
 - Go to >
 ALT + V
- Click add variable
- Select the series you wish to open by doing one of the following:
- Navigate through the menus to select the series
 ALT + N to enter the series in the format code@database in the formula bar and select
  or
or  ENTER
ENTER ALT + D to open the database, and navigate through it via the menus or
  N to enter the code name and select OK or
  ENTER
ENTER
 Follow these steps if there is at least one data series already open on the graph. If it is a blank tab,
follow step 2 first.
Add a constant
- Open the constant value dialog by doing one of the following:
- Click add a constant variable
 from the Graph Settings toolbar
 - Go to >
 CTRL + ALT + C
- Click add a constant variable
- Enter a value
- Click OK or
 ENTER
ENTER
Add a trend line
See Insert a Trend Line.
Example
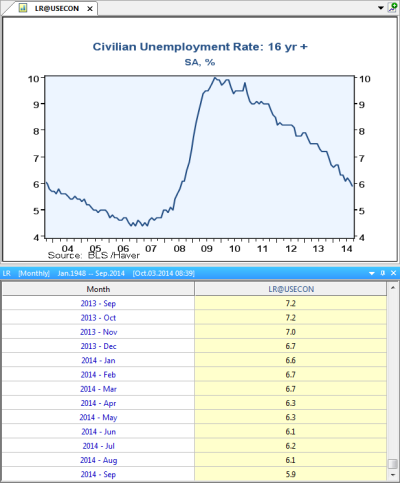
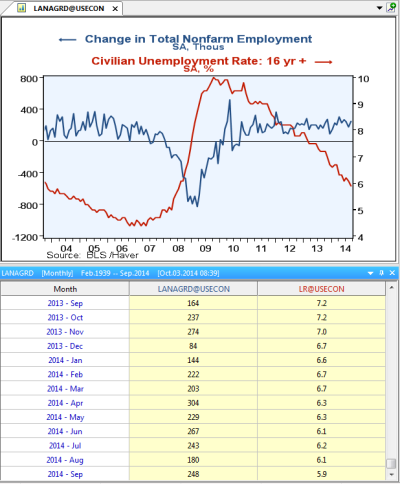
Add LANAGRD@USECON to the LR@USECON graph.
- The graph originally contains U.S. Unemployment Rate (LR@USECON).
- Add a variable to the graph by doing one of the following:
- Click add variable
 from the Graph Settings toolbar
 - Go to >
 ALT + V
- Click add variable
- Insert U.S. Total Nonfarm Employment (LANAGRD@USECON) by doing one of the
following: ALT + N to enter LANAGRD in the formula bar and select
  or
or  ENTER
ENTER N to enter LANAGRD and select OK or
  ENTER
ENTER
 Not required to enter LANAGRD@USECON as we are already in the USECON database
 Not required to use
  ALT + D as we are already in the USECON database


Notice that LANAGRD@USECON is now the active seriesThe first variable listed on a graph; all operations/functions will be applied to this series..
When choosing to remove a variable, the last variable listed in the titles will be the variable that is removed.
- Ensure that the variable you wish to remove is the last variable
- If it's not at the bottom of the list of titles, exchange variables to move the variable to the bottom of the list
- Remove the variable by doing one of the following:
- Click remove variable
 from the Graph Settings toolbar
 - Go to >
 CTRL + V
- If in Column Mode, right click the series you wish to remove and select
- Click remove variable
Why exchange variables?
- To reorder titles
- To make a variable active (move the variable to the top of the list)
- To enable a variable to be removed (move the variable to the bottom of the list)
Exchange two variables
If there are only two variables in the graph, exchange them by doing one of the following:
- Click exchange multiple variables
 from the graph settings toolbar
 - Go to >
-
 X
X
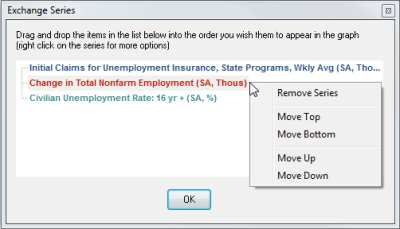
Exchange multiple variables
- Open the Exchange Series window by doing one of the following:
- Click the exchange multiple variables
 from the Graph Settings toolbar
 - Go to >
 ALT + X
- Click the exchange multiple variables
- Select the variable you wish to move by dragging and dropping it in the list
- Click OK or
 ENTER
ENTER
 Right click a variable to get additional options: remove series, move to top/bottom or move up/down.
