Apply functions to one or more variables.
Apply a basic function
- Ensure that the variable you wish to apply the function to is the active seriesThe first variable listed on a graph; all operations/functions will be applied to this series..
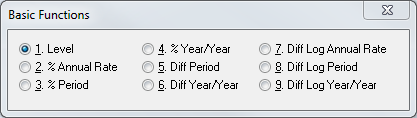
- Open the Basic Functions window as shown above by doing one of the following:
- Click Functions
 from the Graph Settings toolbar
 - Go to >
 F
F
- Click Functions
- Apply the function by doing one of the following:
- Select the function
- Use the keyboard shortcut to enter the number corresponding to the function
List of basic functions and their descriptions
Assume:
-
 = number of periods per year, i.e. the frequency of the data series
-
 = number of observations in the data series
 -
For a specified value of
 , where can be in the range of 1 to
| Function | Description | Formula |
|---|---|---|
| Level (default) | Untransformed data | |
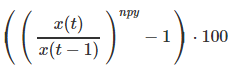
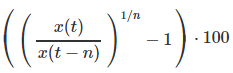
| % Annual Rate | Percentage change at compound annual rate |
DIFA%(X) =
|
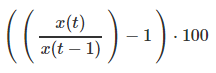
| % Period | Period to period percentage change |
DIFF%(X) =
|
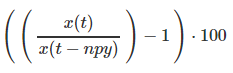
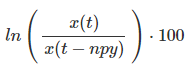
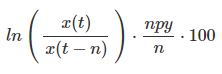
| %Year/Year | Year over year percentage change |
YRYR%(X) =
|
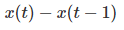
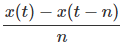
| Diff Period | Period to period difference change |
DIFF(X) =
|
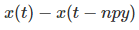
| Diff Year/Year | Year over year difference change |
YRYR(X) =
|
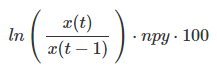
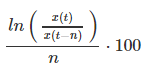
| Diff Log Annual Rate | Log change - compound annual rate |
DIFAL(X) =
|
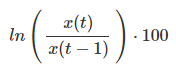
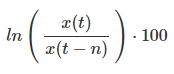
| Diff Log Period | Log change - period to period |
DIFFL(X) =
|
| Diff Log Year/Year | Year to year log change |
YRYRL(X) =
|
Advanced Functions are defined by four different parameters:
- Number of periods ()
- Function (level, % change, change or log change)
- Mode (point-to-point, average or annualized)
- Centered or not centered
 % change of a series cannot be applied to series that have a diff type of 1 (which means that it has a data value of 0 or a negative number)
Apply an advanced function
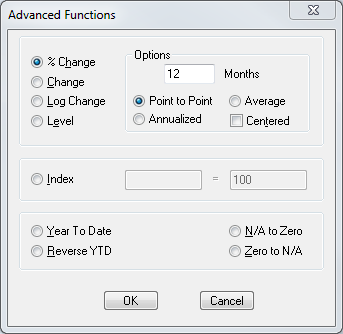
- Ensure that the variable you wish to apply the function to is the active seriesThe first variable listed on a graph; all operations/functions will be applied to this series..
- Open the Advanced Functions window by doing one of the following:
- Click Advanced Functions
 from the Graph Settings toolbar
 - Go to >
- ALT + F
- Click Advanced Functions
- Select the type of function and its options
- Click OK or ENTER
Index a series
- With the Advanced Functions window open, select Index
- Enter the date in one of the following formats:
- YYYYMM (monthly)
- YYYYQ (quarterly)
- YYYY (annually)
- Enter the index number
- Click OK or ENTER
Other options in advanced function
The following options can be applied to any type of function or index:
- Year to date
- Reverse YTD
- N/A to Zero
- Zero to N/A
List of advanced functions and their descriptions
| Function | Formula |
|---|---|
| Point to Point % Change |
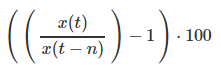
|
| Average % Change |
|
| Annualized % Change |
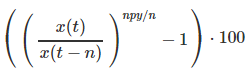
|
| Point to Point % Change Centered | Same formula as Point to Point % Change using centered values |
| Average % Change Centered | Same formula as Average % Change using centered values |
| Annualized % Change Centered | Same formula as Annualized % Change using centered values |
| Point to Point Difference Change |
|
| Average Difference Change |
|
| Annualized Difference Change |
|
| Point to Point Difference Change Centered | Same formula as Point to Point Difference Change using centered values |
| Average Difference Change Centered | Same formula as Average Difference Change using centered values |
| Annualized Difference Change Centered | Same formula as Annualized Difference Change using centered values |
| Point to Point Log Change |
|
| Average Log Change |
|
| Annualized Log Change |
|
| Point to Point Difference Log Change Centered | Same formula as Point to Point Log Change using centered values |
| Average Difference Log Change Centered | Same formula as Average Difference Log Change using centered values |
| Annualized Difference Log Change Centered | Same formula as Annualized Difference Log Change using centered values |
| Moving Average |
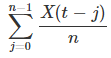
|
| Annualized Moving Total |
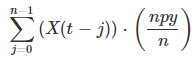
|
| Moving Total |
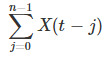
|
| Moving Average Centered | Same formula as Moving Average using centered values |
| Annualized Moving Total Centered | Same formula as Annualized Moving Total using centered values |
| Moving Total Centered | Same formula as Moving Total using centered values |
| Index to a Year/Quarter/Month |
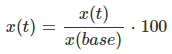
|
| Year to Date | |
| Reverse Year to Date | |
| N/A to Zero | |
| Zero to N/A |
Uses concurrent seasonal adjustment, which takes all the defaults of X12-ARIMA. It determines whether to use a multiplicative or additive model based on the type Haver has set for the series. (Multiplicative model will always be used unless the series has a negative or zero value present). Seasonal adjustment can be only applied to a monthly or quarterly data series with at least 36 observations.
Apply seasonal adjustment
Do one of the following to apply seasonal adjustment:
- Click Seasonal Adjustment Function
 from the Graph Settings toolbar
 - Go to >
-
SHIFT + S
Modify seasonal adjustment
Edit seasonal adjustment settings first, then apply seasonal adjustment.
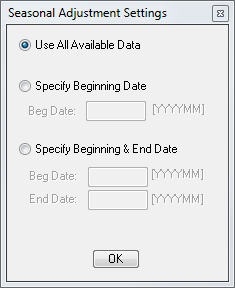
- Open seasonal adjustment settings by doing one of the following:
- Click the drop-down arrow of and select
- Go to >
- CTRL + ALT + S
- Click the drop-down arrow of
- Edit the selection then click OK or ENTER
- Apply seasonal adjustment as shown above
Convert any data series that has local currency data type (LocCur) to US dollars by doing one of the
following:
- Go to >
-
$