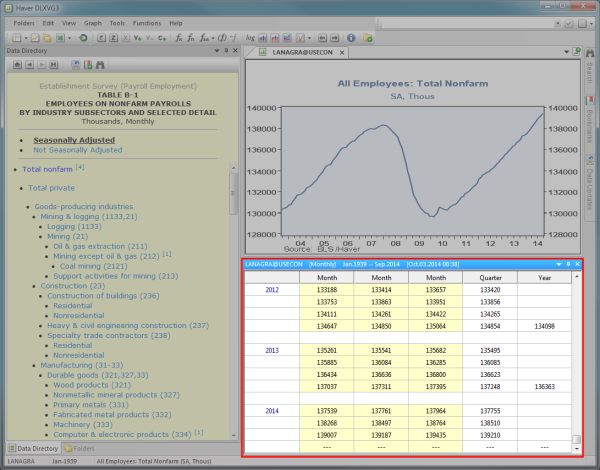
After browsing through the menus and clicking on a series, DLXVG3 displays its data observations on the data table.

The title bar
Displays the following info for the active seriesThe first variable listed on a graph; all operations/functions will be applied to this series.:
- Series name
- Frequency
- Time span
- Date & time of the last update
The data table
Displays the observations of the data series. The background color of the data table indicates the type of data displayed. The following is a list of background colors and their meanings:
- Yellow - data observations from an active graph
- Blue - data observations from a saved graph
- Gray - data observations with aggregation, interpolation or magnitude applied
Data observation mode
The data table displays the observations in one of two ways:
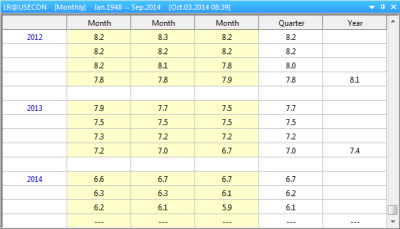
Haver Mode displays data aggregated to lower frequencies in addition to the original frequency. Monthly observations are read from left to right.
 If there is more than one variable in the graph, only the data values for the active seriesThe first variable listed on a graph; all operations/functions will be applied to this series. are displayed.
View data in Haver Mode
- Right click on the data table
- Select
Example
View U.S. Unemployment Rate in Haver Mode. The table below shows monthly values followed by yearly aggregated values in the column titled Year. The data observations for January, February and March 2014 are 6.6, 6.7 and 6.7 respectively.

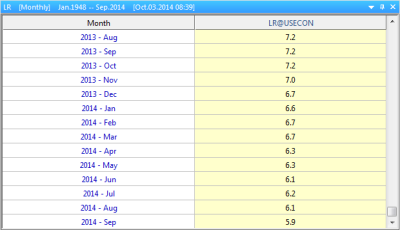
Column Mode does not display aggregated values as above. In this mode, you have the ability to view data for multiple series of the same frequency and remove variables.
View data in column mode
- Right click on the data table
- Select
Example
View U.S. Unemployment Rate in Column Mode. In the table below, only monthly values (the default frequency) of the series are displayed.

View data of different frequencies
By default, column mode displays values of data series that are of the same frequency as the active series. To also view variables of different frequencies do the following:
- Right click on the data table
- Select
 Data series of lower frequencies will display repeated values to line up with the higher frequency.
Remove a variable from the data table
- Right click the cell of the variable
- Select
This is useful for saving a transformed series and/or duplicating it with another series at a later time.
- Right click on the series in the data table
- Select