Modify the x and y axes of the graph.
Zoom
Used to display more or less history by changing the number of years, quarters, months, weeks or days visible.

- Open the zoom dialog by doing one of the following
- Go to >
 Z
Z- Double click on the X-axis
- Enter the number and date frequency
- Click OK or
 ENTER
ENTER
 The number shown in the brackets represents the current selection. The default value is 11 years for monthly, quarterly and yearly series.
 The following formats are available:
- 6y = 6 years
- 6q = 6 quarters
- 6m = 6 months
- 6w = 6 weeks
- 6d = 6 days
- leaving the entry blank = the total date span
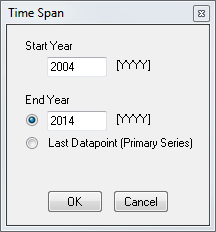
Start and End Year
Change the start and end date of the graph.

- Open the time span dialog by doing one of the following:
- Go to >
- Go to >
 Y
Y C
C
- Enter the start year in the format YYYY
- Enter the end year in the format YYYY or select "Last Datapoint (Primary Series)"
- Click OK or
 ENTER
ENTER
 Both start year and end year must be applied together.
 End year and current year are now used interchangeably
This functionality has been deprecated (no longer available) as of version 4.117. See above section for the new functionality.
Alignment
Align graphs by frequency

- Open the alignment dialog by doing one of the following:
- Go to >
 ALT + A
- Select frequency
- Click OK or
 ENTER
ENTER
Scaling
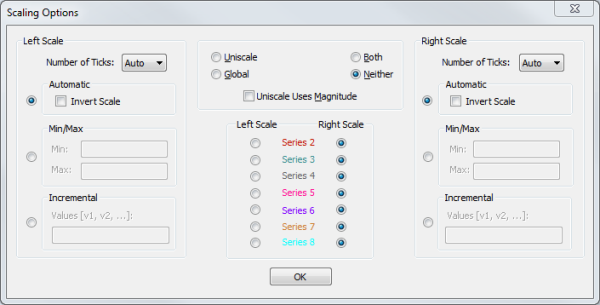
Change the scaling on the active graph.
- Open Scaling Options by doing one of the following:
- Go to > >
 S
S- Double click on the Y-axis

- Make the necessary changes.
Four types of scales
- Uniscale - uses the same scale for all series
- Global - uses the scale for the entire lifetime of the series
- Both - uses both uniscale and global
- Neither (default) - uses neither uniscale nor global
Additional options
- Uniscale uses magnitude- scaling uses magnitude of series to graph datapoints
- Invert Scale
- Left/Right scale option for a series (Series 1 always uses the Left Scale)
- Number of Ticks - to be displayed on the y-axis
- Min/Max - to set the min and max number on the y-axis
- Incremental - to set the increment between ticks