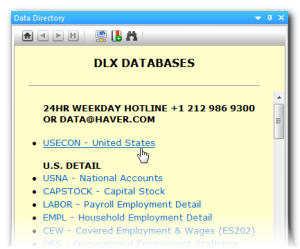
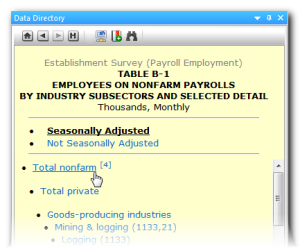
DLXVG3 displays a data series in two formats: as a graph and a data table. Navigate through the menus in the data directory to view the contents of the databases and select a series to display.
Displaying a data series
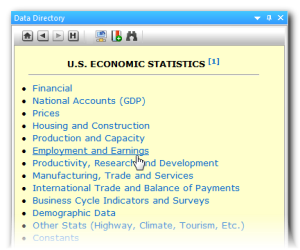
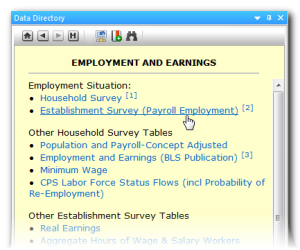
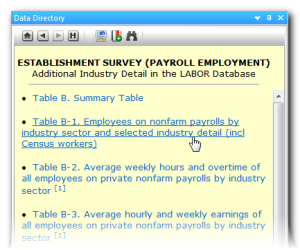
- Select a database.
- Click through the menus to select a data series.
- The workspace now contains three windows: the data directory, the graph area and the data table.
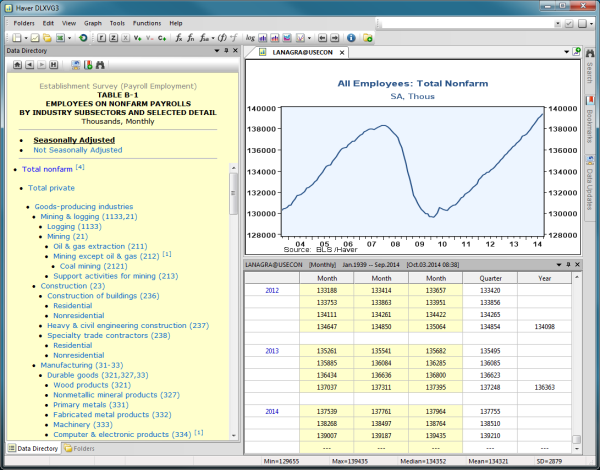
 This is the default view.