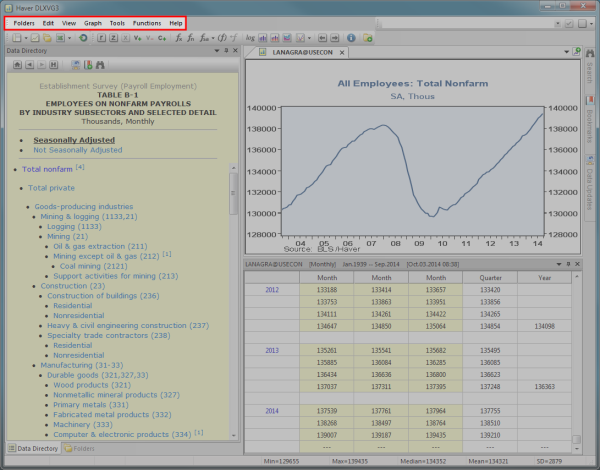
DLXVG3's workspace includes a menu bar at the top of the application containing several options.
| Item | Shortcut Keys | Description |
|---|---|---|
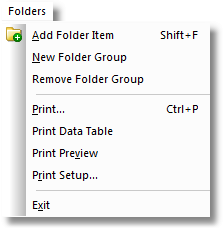
| Add Folder Item | SHIFT + F | Opens Folders Mode where you can add a graph into a folder. |
| New Folder Group |
Opens a New Folder Group where you can add a folder. |
|
| Remove Folder Group | Opens the Remove Folder Group dialog where you can select a folder to be removed from the Folder Directory. | |
| CTRL + P |
Prints the document. |
|
| Print Data Table |
Opens a dialog where you can select the range of data that you want to print. |
|
| Print Preview |
Opens the Print Preview in the graph area where you can see how a document looks before printing it. |
|
| Print Setup |
Opens a dialog where you can select the default printer, paper size, and orientation for the document. |
|
| Exit | ALT + F4 |
Closes the application. |
| Item | Shortcut Keys | Description |
|---|---|---|
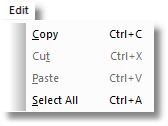
| Copy | CTRL + C | Copies the selection and sends it to the clipboard. |
| Cut | CTRL + X |
Cuts the selection and sends it to the clipboard. |
| Paste | CTRL + V | Pastes the selection from the clipboard to the place where the cursor is located. |
| Select All | CTRL + A |
Selects all content in the active window. |
| Item | Shortcut Keys | Description |
|---|---|---|
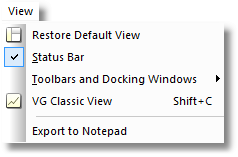
| Restore Default View | Restores the default view for your workspace. | |
| Status Bar |
Toggles on/off the status bar at the bottom of the application window. |
|
| Toolbars and Docking Windows |
Opens a submenu which lets you select toolbars and docking windows to display; also has the option to customize. |
|
| VG Classic View | SHIFT + C |
Toggles on/off classic view (full display of graph area) for your workspace. |
| Export to Notepad | Opens the workspace into notepad mode for exporting codes to a notepad. |
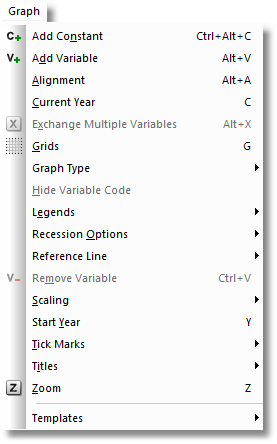
| Item | Shortcut Keys | Description |
|---|---|---|
| Add Constant | CTRL + ALT + C | Opens a dialog box where you can enter a value to be inserted on the graph. |
| Add Variable | ALT + V |
Adds an additional series on the graph. |
| Alignment | ALT + A |
Opens a dialog box where you can apply a frequency of Quarterly, Monthly, Annual or None. |
| Current Year | C |
Opens a dialog box where you can set the end year of the graph in YYYY format or select last datapoint. |
| Exchange Multiple Variables | ALT + X | Opens a dialog box where you can drag and drop variables to rearrange their order when there are 3+ variables. If there are only 2 variables, it will simply exchange them. |
| Grids | G | Opens a dialog box where you can apply horizontal, vertical, both or neither grid style. |
| Graph Type |
Opens a submenu where you can change the graph type to: |
|
| Hide Variable Code | Hides the variable code. | |
| Legends |
CTRL + L CTRL + ALT + L |
Opens a submenu with the following options:
|
| Recession Options |
Opens a submenu with the following options: |
|
| Reference Line | Opens a submenu where you can select either a horizontal or a vertical reference line. | |
| Remove Variable | CTRL + V | Removes the bottom variable shown on the graph. |
| Scaling | S |
Opens a sub menu where you can select Options, Left Y-axis Settings or Right Y-axis Settings. |
| Start Year | Y | Opens a dialog box where you can set the start year of the graph in YYYY format. |
| Tick Marks |
K CTRL + K |
Opens a submenu where you can choose:
|
| Titles | Opens a submenu where you can select to edit the Main Title, Top Title or Y-Axis Titles Left or Y-Axis Title Right. | |
| Zoom | Z | Opens a dialog box where you can zoom in/out with a specified time span. |
| Templates |
Opens a submenu with the following options: |
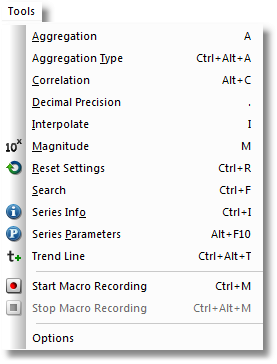
| Item | Shortcut Keys | Description |
|---|---|---|
| Aggregation | A | Opens a dialog box where you can apply a frequency of Weekly, Monthly, Quarterly, Annual or None. |
| Aggregation Type | CTRL + ALT + A |
Opens a dialog box where you can change the aggregation type to Sum, Average, EOP (end of period) or Default. |
| Correlation | ALT + C |
Toggles on/off correlation. |
| Decimal Precision | . |
Opens a dialog box where you can change the growth rate decimal precision. |
| Interpolate | I | Toggles on/off interpolation for the primary series to fill in missing values. |
| Magnitude | M | Opens a dialog box where you can change the magnitude to Thousands, Millions, Billions, Trillions, Quadrillions or Default. |
| Name List | CTRL + N | Opens a dialog box which lists all the series names and descriptors for the current database selected |
| Reset Settings | CTRL + R | Restores the graph to its original setting. |
| Search | CTRL + F | Opens the search window. |
| Series Info | CTRL + I | Opens a dialog box which displays the codes and labels for the series displayed. |
| Series Parameters | ALT + F10 | Opens a dialog box which displays the parameters for the primary series. |
| Trend Line | CTRL + ALT + T | Inserts a linear trend line for the primary series. |
| Start Macro Recording | CTRL + M | Starts macro recording. |
| Stop Macro Recording | CTRL + ALT + M | Stops macro recording. |
| Options | Opens a dialog box where you can make changes to General, Recession, Cycle Graph, Seasonal Adjustment and Excel Options. |
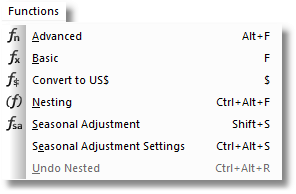
| Item | Shortcut Keys | Description |
|---|---|---|
| Advanced | ALT + F | Opens a dialog box where you can apply advanced functions to the primary series. |
| Basic | F |
Opens a dialog box where you can apply basic functions to the primary series. |
| Convert to US$ | $ |
Converts currency to US dollars. |
| Nesting | CTRL + ALT + F |
Toggles on/off the ability to nest functions. |
| Seasonal Adjustment | SHIFT + S | Applies seasonal adjustment to the primary series. |
| Seasonal Adjustment Settings | CTRL + ALT + S | Opens a dialog box to specify the data used. |
| Undo Nested | CTRL + ALT + R | Removes the most recent nested function. |
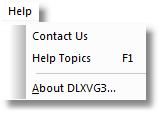
| Item | Shortcut Keys | Description |
|---|---|---|
| Contact Us | Displays contact information for Haver Analytics. | |
| Help Topics | F1 |
Opens the DLXVG3 help topics in another window. |
| About DLXVG3 |
Displays the version of DLXVG3 that you are using. |