Change the style of the series/graph. The following options are available:
This is the default graph style. Displays continuous data over time set against a common scale and therefore ideal for showing trends in data at equal intervals.
Example
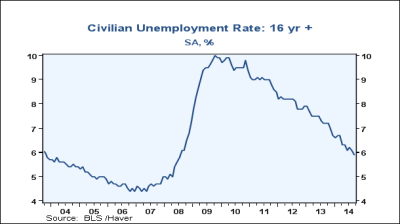
Line Graph of LR@USECON.
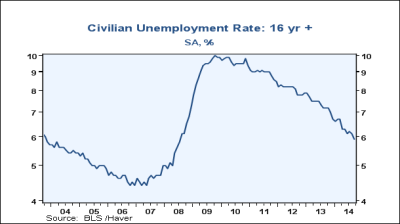
Displays the value of a physical quantity using intervals corresponding to orders of magnitude, rather than a standard linear scale.
Toggle log scale
- Click
 from the Graph Settings toolbar
Example
Line Graph of LR@USECON with log scale.
Useful for showing data changes over a period of time or for illustrating comparison among items.
Toggle bar graph
Do one of the following:
- Click
 from the Graph Settings toolbar
 -
 B
B
Example
Bar Graph of LANAGRD@USECON and Line Graph of LR@USECON.
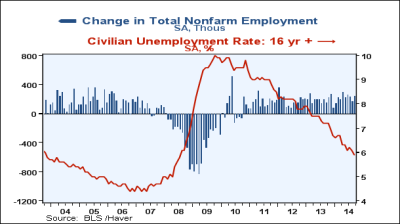
 Only the active seriesThe first variable listed on a graph; all operations/functions will be applied to this series. and any series added after it will be a bar graph. To convert all series, use Exchange Variables and toggle on bar graph again for that series.
Shows the relationship of individual items to the whole, comparing the contribution of each value to a total across categories.
Toggle stacked bar graph
- Click
 from the Graph Settings toolbar
Example
Stacked Bar Graph of LAGOODD@USECON and LAPSRVD@USECON.
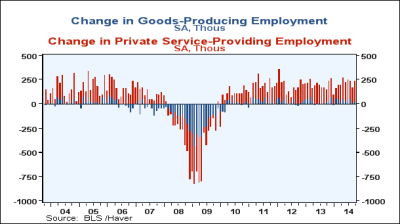
Emphasizes the magnitude of change over time and can be used to draw attention to the total value across a trend.
Toggle stacked area graph
- Click
 from the Graph Settings toolbar
Example
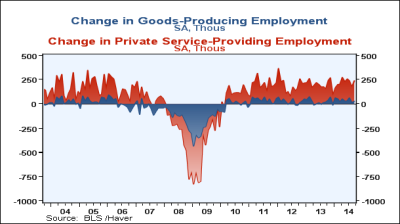
Stacked Area Graph of LAGOODD@USECON and LAPSRVD@USECON.
Cycle graphs provide the ability to compare and contrast the evolution of a variable across multiple discrete time periods. Time periods can be specified manually or linked to criteria such as recessionary periods.
 When you have multiple series in a chart, cycle graph is only applied to the active seriesThe first variable listed on a graph; all operations/functions will be applied to this series..
Toggle cycle graph
- Click
 from the Graph Settings toolbar
Change cycle graph settings
- Open the Cycle Graph Settings dialog by doing one of the following:
- Click the drop-down arrow from
 and select
 - Go to > > Cycle Graph
- Click the drop-down arrow from
- In the Style field, choose one of the three cycle graph options
- The settings options will vary slightly depending on the style of cycle graph chosen.
- If you chose Cycle Graph (Recession Linked) the settings are the following:
- Recession Country - specifies which country's recession country should be used
- Apply Index Function - option to apply an index function to all available cycles
- Date Span Start - specifies a start date for the entire span
- Date Span End - specifies an end date for the entire span
- For Anchor Dates Use - specifies if trough or peak values are used
- Periods Before - specifies the number of periods before each cycle's start date
- Periods After - specifies the number of periods after each cycle's start date
- If you chose Cycle Graph (Custom Shading) the settings are the same as above except instead of Recession Country, the property is Custom Shading where you can select your own custom recessions to use
- If you chose Cycle Graph the settings are the following:
- Apply Index Function - option to apply an index function to all available cycles
- Mode - choose between All Same Length, Custom Length or Annual
- If you choose All Same Length then the following settings are available:
- Number of Cycles - specifies number of cycles to include between one and eight
- Periods Before - specifies the number of periods before each cycle's start date
- Periods After - specifies the number of periods after each cycle's start date
- Cycle # Date - specifies the date for each cycle depending on how many number of cycles were chosen
- If you choose Custom Length then the following settings are available:
- Number of Cycles - specifies number of cycles to include between one and eight
- Cycle Dates- specifies the date, periods before and periods after for each cycle depending on the number chosen
- If you choose Annual then the following settings are available:
- Number of Cycles - specifies number of annual cycles to include between one and eight
- Date Span Start- specifies a start date for the entire span
- If you choose All Same Length then the following settings are available:
- If you chose Cycle Graph (Recession Linked) the settings are the following:
Example 1
Cycle Graph (Recession linked) of LANAGRD@USECON.
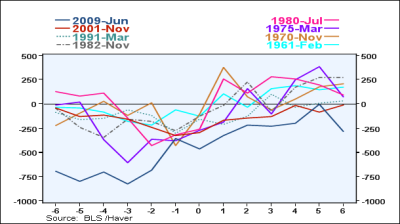
 The graph uses the following settings: USA for the recession country, 1915 as the date span start, 2015 as the date span end, trough values for anchor dates, 6 periods before and 6 periods after.