To open Template Options to format the current graph's style properties do one of the following:
- Right click on the graph and select
- Go to > >
To make changes to multiple graphs or to save your custom settings as a new template, see
Managing Templates.
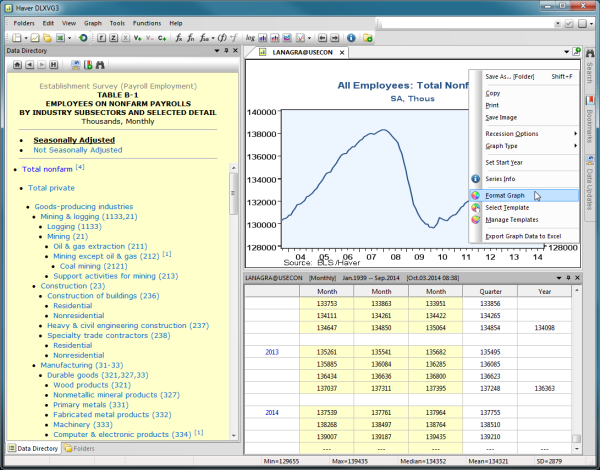
 Alternatively, you can right click any graph item to quickly access its styles.
| Style | Property |
|---|---|
| Border |
|
| X-Axis |
|
| Y-Axis Left |
|
| Y-Axis Right |
|
| Inner graph tick marks |
|
| Match y-axis colors/titles |
|
| Y-axis #,#### format |
|
| Y-axis tick marks |
|
| Style | Property |
|---|---|
| Match Color |
|
| Show Data Labels |
|
| Bar # |
|
| Bar Offset |
|
| Bar Border Color |
|
| Style | Property |
|---|---|
| Background |
|
| Border |
|
| Grid |
|
| Recession |
|
| Crop |
|
| Graph Area Position |
|
| Style | Property |
|---|---|
| View Options |
|
| Text |
|
| Style | Property |
|---|---|
| Match Color |
|
| Line # |
|
| Style | Property |
|---|---|
| Source |
|
| Date and Time |
|
| Horizontal Reference Line |
|
| Zero Reference Line |
|
| Show scale arrows |
|
| Comma as decimal separator |
|
| Area graph solid color |
|
| Style | Property |
|---|---|
| Match Color |
|
| Top Title |
|
| Title # |
|