DLXVG3 uses a linear trend line to reveal a linear relationship between two variables,  and
and  , in the form
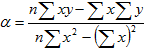
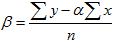
where  is the slope and
  is the -intercept, and are calculated as follows where
  represents the number of data points.
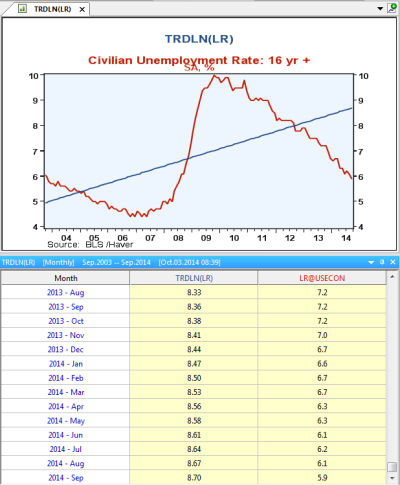
 The trend line is calculated with the number of data points that are visible on the graph.To change the number of data points on the graph, zoom in/out of the graph. This will also change the slope and -intercept as indicated in the status bar.
Do one of the following:
- Go to >
-
 CTRL + ALT + T
Example
The graph displays a trend line inserted to LR@USECON.