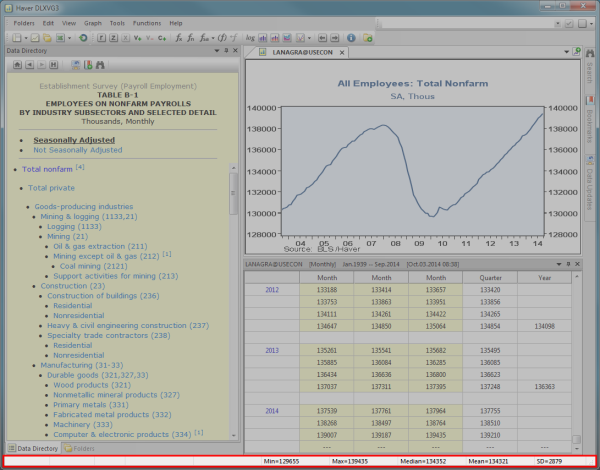
The status bar appears at the bottom of the DLXVG3 interface and keeps you informed of certain information depending on the action performed.

When navigating through a database and hovering over a series, the following information can be found in the status bar on the bottom left of the workspace:

- Series code
- Start date of series
- Brief description of series
When a series is displayed in the graph area, the following values can be found in the status bar on the
bottom right of the workspace:

- Min
- Max
- Median
- Mean
- SD (Standard Deviation)
 This information is calculated based on the data currently shown in the graph. If you zoom in/out, the values in the status bar will recalculate accordingly.
When a trend line has been applied to a series, the values for  -intercept and slope are added to the status bar as illustrated below:

-
 -intercept
 - Slope
- Min
- Max
- Median
- Mean
 This information is calculated based on the data currently shown in the graph. If you zoom in/out, the values in the status bar will recalculate accordingly.