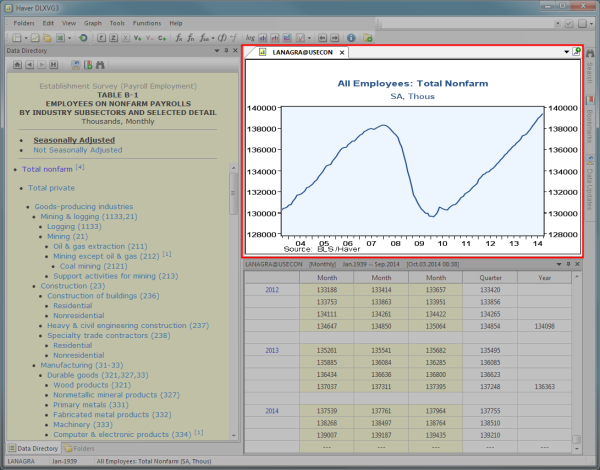
After browsing through the menus and clicking on a series, DLXVG3 will graph its data observations in the Graph Area.
Data snapshots provide data point values on a series when performing one of the following:
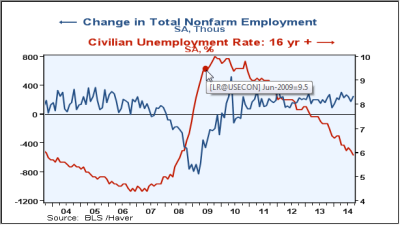
Hovering over a data point
Displays a dot on the data point observed and its code@database, date and value in a snapshot.
Example
Observation of LR@USECON and LANAGRD@USECON.
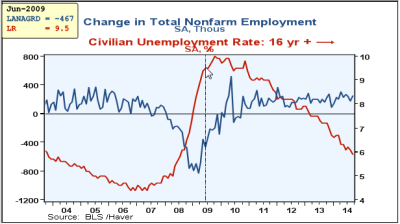
Clicking on the graph
Displays a dotted line and a snapshot at the top left corner of the graph of the date observed, the codes and their values.
Example
Observation of LR@USECON and LANAGRD@USECON.
Use multiple tabs to switch back and forth between different graphs.
Display a graph in a new tab
- Do one of the following to open a new tab:
- Click the New Graph button

 CTRL + T
- Click the New Graph button
- Open a new series or a saved graph.
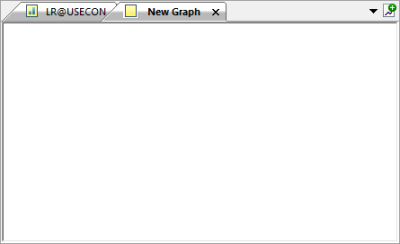
 The type of graph that you have opened is indicated by its icon in the tab.
-
 Represents an active graph
 -
 Represents a saved graph
 -
 Represents a saved graph that has been sent to active view
The active tab button (located at the top right corner of the graph area) stores the list of all graphs opened in the graph area. Use the button to quickly access an opened graph.
 When the number of graphs opened is greater than the number of tabs visible, the active tab button changes from
  to
to  .
.
Access an opened graph via the active tab button
- Click the active tab button
 or
or 
- Select the graph from the list
Reorder your tabs
- Click the graph you wish to move by its title
- Drag and drop it before or after another tab
View them side by side for comparison
- Click the graph you wish to move by its title
- Drag and drop it to the top/bottom or left/right edge of the graph area
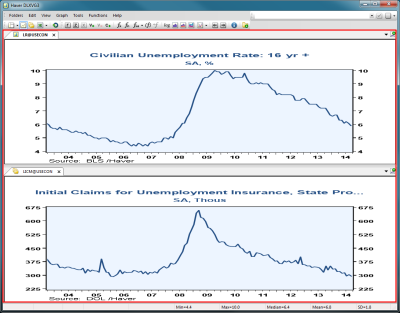
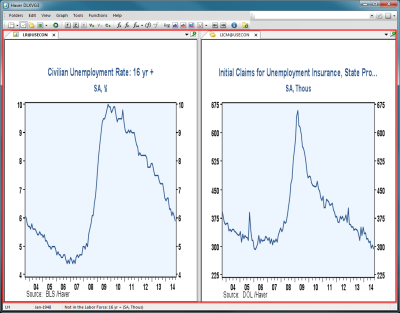
 Best used in Classic View.
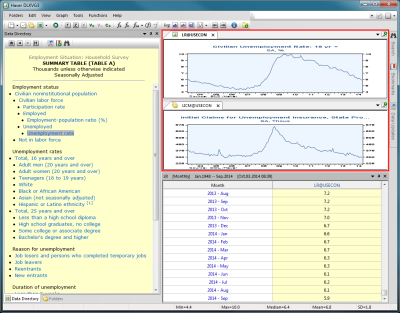
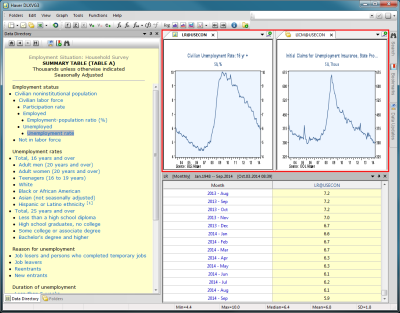
Example 1
Default View with graphs in top/bottom and left/right.
Example 2
Classic View with graphs top/bottom and left/right.
Create a copy of an active graph in a new tab to add/remove variables, functions and transformations without having to start from scratch.
- Select the active graph.
- Do one of the following:
- Right click on its tab and select
 CTRL + SHIFT + T
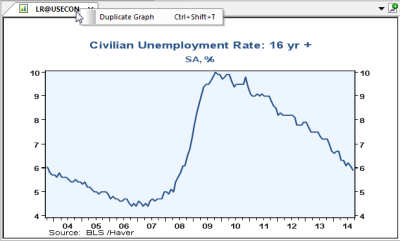
 If the graph is a saved graph, right click the graph area and select or use the shortcut
  ALT + V
Edit graph items (such as titles, scaling, etc.) on a graph in active view
- Double click on the item
- Make the changes
- Click OK or
 ENTER
ENTER
Format an item's color, style, etc. on a graph in active view
- Right click the item
- Make the changes
- Click Save
 to apply the format to the current graph
 Click the drop-down arrow to save the changes to your current template or create a new template.
Graph option shortcuts
Right click on the graph to display the graph options such as save, copy, print, format, select and manage templates.
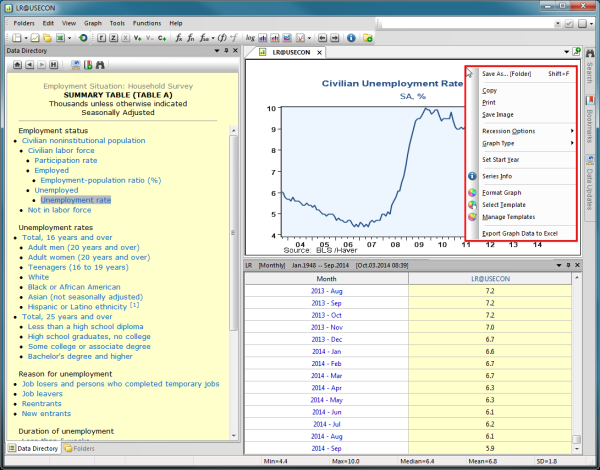
 When the graph is not in active view, some of the options shown above will be grayed out and some additional options will be available, such as the option to send the graph to active view.