Values can be grouped together to form a single value of more significant meaning or measurement by using aggregation. You can aggregate a series to a lower frequency.
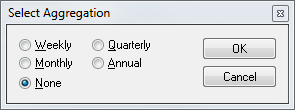
- Open the Aggregation window by doing one of the following:
- Go to >
 A
A
- Select the aggregation frequency
- Click OK or
 ENTER
ENTER
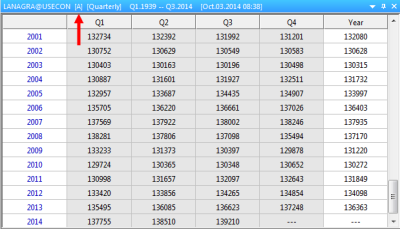
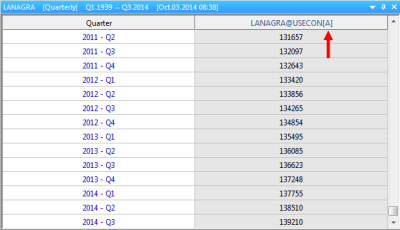
 When aggregation is on, it will be indicated by the symbol [A] next to the series(code@database) in the title bar in Haver Mode or in the data table in Column Mode. Additionally, the background color of the table will be changed to gray.
 To turn off aggregation, open the Aggregation window and select None
Example
Change in U.S. Total Nonfarm Employment (LANAGRA@USECON) with quarterly aggregation applied as shown below
- Open the Aggregation Type window by doing one of the following:
- Go to >
 CTRL + ALT + A
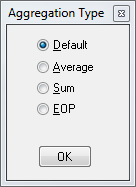
- Select the aggregation type
- Click OK or
 ENTER
ENTER
 By default an aggregation type is defined for every series. There are three different aggregation types: average, sum and end of period. The aggregation type will be undefined for an annual series or not allowed for certain series where aggregation would produce incorrect results.
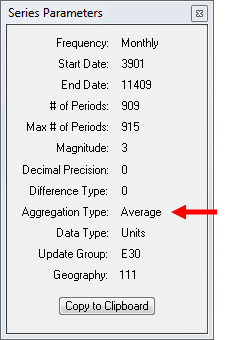
 These are the series parameters for LANAGRA@USECON.
Look at the series parameters by doing one of the following:
- Go to >
-
 ALT + F10
