A data transformation is a basic arithmetic operation applied to two variables.
The transformation toolbar, as shown below, will become available when at least two variables are on the graph.
Apply a basic arithmetic operation to two variables to create a new variable. You can then insert another variable to the graph to perform another transformation.
The following is an example of a data transformation.
Example
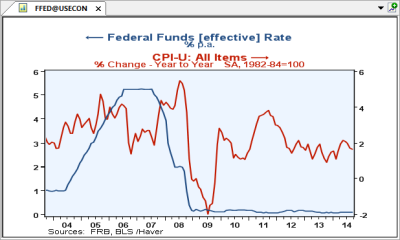
Subtracting the year-over-year change in CPI from the federal funds rate to calculate a real interest rate and then adding the growth in real GDP.
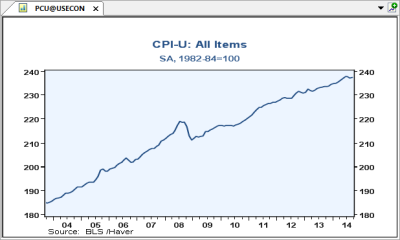
- Open PCU@USECON by doing one of the following:
- Navigate through the menus.
 ALT + D for USECON then N for PCU
- ALT + N and enter PCU@USECON in the formula bar
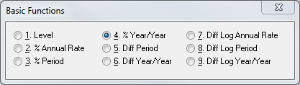
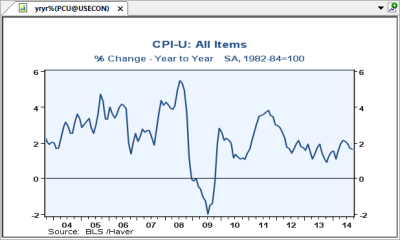
- Apply a period-to-period percent change to PCU@USECON by doing one of the following:
- Go to > or click
 from the Graph Settings toolbar then select option 4
 - F then 4
- Go to > or click
- Add FFED@USECON
- Add a variable by doing one of the following:
- Click
 from the Graph Settings toolbar
 - ALT + V
- Click
- Open FFED@USECON by doing one of the following:
- Navigate through the menus
- N for FFED
- ALT + N and enter FFED in the formula bar
 Not required to enter FFED@USECON as we are already in the USECON database
Not required to use ALT + D as we are already in the USECON database
- Add a variable by doing one of the following:
- Subtract YRYR%(PCU@USECON) from FFED@USECON by doing one of the following:
- Click
 from the Transformations toolbar
 - –
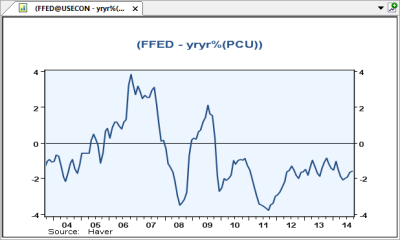
- Click
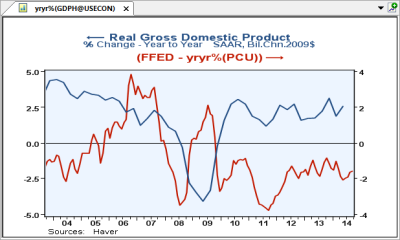
- Add the GDPH@USECON series and apply a period to period percent change on it
Add a variable by doing one of the following:
- Click from the Graph Settings toolbar
- ALT + V
- Click
- Open GDPH@USECON by doing one of the following:
- Navigate through it via the menus
- N for GDPH
- ALT + N and enter GDPH in the formula bar
Not required to use ALT + D as we are already in the USECON databaseNot required to enter GDPH@USECON as we are already in the USECON database - Apply period-to-period percent change to GDPH@USECON by doing one of the following:
- Go to > or click from the Graph Settings toolbar and select option 4
- F then 4
- Go to > or click
- Add yryr%(GDPH) to FFED-yryr%(PCU) by doing one of the following:
- Click
 from the Transformations toolbar
 - +
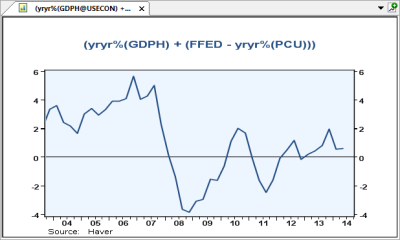
- Click
The transformation is complete.