Customize your graph by inserting the following items:
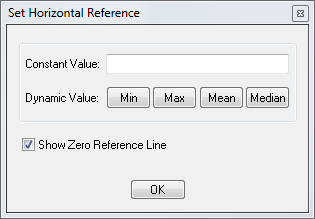
Insert a constant value for the reference line
- Do one of the following:
- Click > >
 Alt + H
- Enter the constant value
- Check/uncheck the zero reference line (it is checked by default)
- Click OK or ENTER
Insert a min, max, mean or median reference line.
- Do one of the following:
- Go to > >
- Alt + H
- Check/uncheck the zero reference line (it is checked by default)
- Select min, max, mean or median reference line
 You can now manage the zero reference line in templates.
Insert a vertical reference line

- Go to > >
- Select the value(s) from the drop-down list
- Click OK or ENTER
These are the options displayed for LANAGRA@USECON which is a monthly series
By default all tick marks are shown.
Display major tick marks
- Do one of the following:
- Go to > >
- CTRL + K
Display all tick marks:
- Do one of the following:
- Go to > >
- K

- Do one of the following:
- Go to >
- G
- Select Horizontal, Vertical, Both or Neither (default).
- Click OK or ENTER
Grid Lines can also be modified in templates.