Lead and Lag is used to shift one variable ahead or back in time so that the movements of two variables are more closely aligned if there is a time lag between a change in one variable and its impact on another.
To lead a series use  CTRL + right arrow and to lag a series use CTRL + left arrow
Example 1
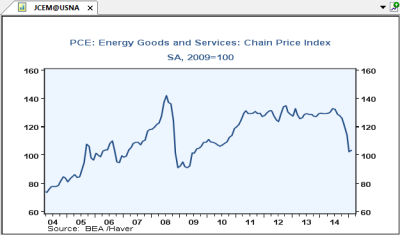
A change in the price of crude oil will impact the price consumers pay for energy, just not immediately. It usually takes around one month for a change in the price of crude oil to be reflected in consumer energy prices. We can create a graph to compare the two by doing the following:
- Open JCEM@USNA by doing one of the following:
- Navigate through the menus.
- ALT + D for USNA then N for JCEM
- ALT + N and enter JCEM@USNA in the formula bar
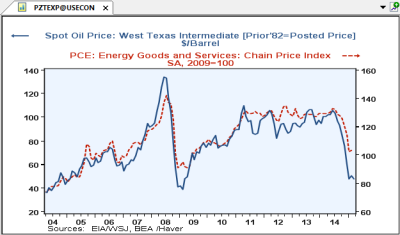
- Add PZTEXP@USECON
- Add a variable by doing one of the following:
- Click
 from the Graph Settings toolbar
 - ALT + V
- Click
- Open PZTEXP@USECON by doing one of the following:
- Navigate through the menus
- ALT + D for USECON N for PZTEXP
- ALT + N and enter PZTEXP@USECON in the formula bar
- Add a variable by doing one of the following:
- Apply a lead of one month to PZTEXP@USECON by doing CTRL + right arrow
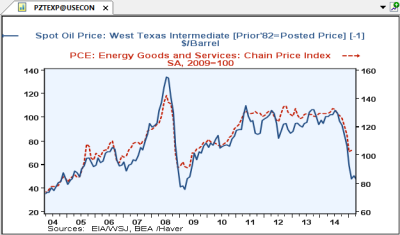
 Notice that there is a [-1] next to the title of PZTEXP@USECON to indicate a lead of 1 month has been applied.
Example 2
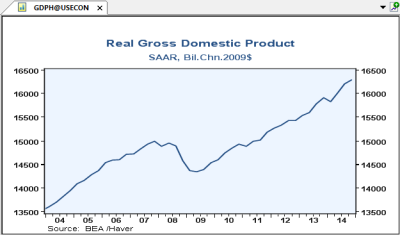
Changes in employment tend to lag the performance of the overall economy, that is, a weaker economy leads to weaker employment and a stronger economy leads to stronger employment, but not immediately. We can create a graph to compare the two by doing the following:
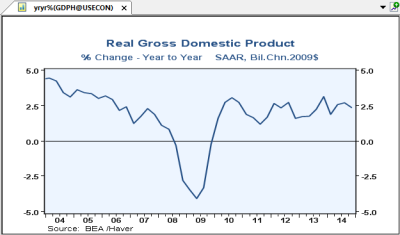
- Open GDPH@USECON by doing one of the following:
- Navigate through the menus.
- ALT + D for USECON then N for GDPH
- ALT + N and enter GDPH@USECON in the formula bar
- Apply function 4: y/y percent change to GDPH@USECON by doing one of the following:
- F + 4
- Go to > or click
 from the Graph Settings toolbar then select option 4
- Add LAPRIVA@USECON
- Add a variable by doing one of the following:
- Click from the Graph Settings toolbar
- ALT + V
- Click
- Open LAPRIVA@USECON by doing one of the following:
- Navigate through the menus
- N for LAPRIVA
- ALT + N and enter LAPRIVA in the formula bar
Not required to use ALT + D as we are already in the USECON databaseNot required to enter LAPRIVA@USECON as we are already in the USECON database
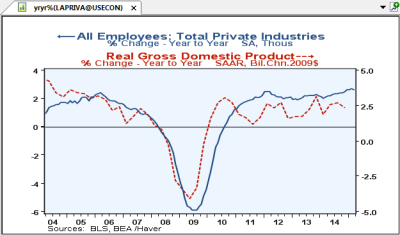 Basic functions carry over when we add another variable, so yryr% was applied to LAPRIVA@USECON since we applied it to GDPH@USECON
 - Add a variable by doing one of the following:
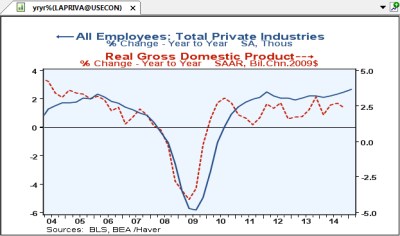
- Change the aggregation of LAPRIVA@USECON to quarterly by doing one of the following:
- A + Q + Enter
- Go to > , select Quarterly and click OK
- Apply a lag of one month to LAPRIVA@USECON by doing CTRL + LEFT arrow
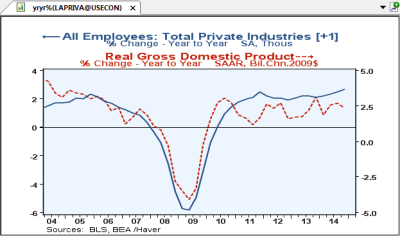
Notice that there is a [+1] next to the title of LAPRIVA@USECON to indicate a lag of 1 month has been applied.