Functions can be combined and entered in the formula bar as a nested function or as transformations. Quickly display a nested function/transformation in the graph by using the formula bar.
Instead of manually applying functions and/or using keyboard shortcuts to create a nested function, simply enter the formula in the formula bar.
Example
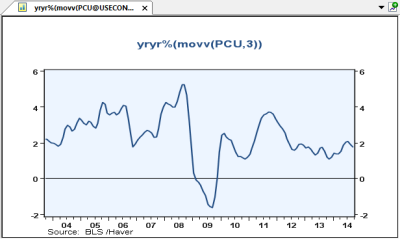
Apply a 3-month moving average to a consumer price index and then apply a period-to-period percent change on top of the previous function.
- Click the formula bar to enter the series or
 ALT + N
 - Enter the formula
- Run the command by clicking
 or
or  ENTER
ENTER - The series will be displayed in the graph area


Instead of manually creating transformations with the transformation toolbar, simply enter the formula in the formula bar.
Example 1
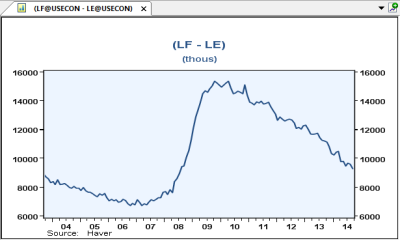
A transformation with codes from the same database: the difference of Civilian Labor Force and Civilian Employment in the U.S.
- Click the formula bar to enter the series or
 ALT + N
 - Enter the formula
- Run the command by clicking
 or
or  ENTER
ENTER - The series will be displayed in the graph area


 The @database does not need to be appended to succeeding codes if they are from the same database as the first code in the formula.
Example 2
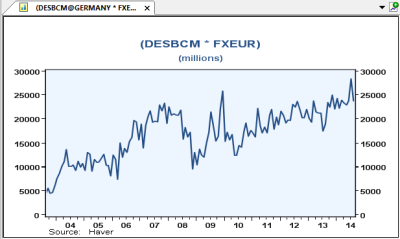
Transformation with codes from different databases: conversion of current account balance for Germany into dollars.
- Click the formula bar to enter the series or
 ALT + N
 - Enter the formula
- Run the command by clicking
 or
or  ENTER
ENTER - The series will be displayed in the graph area


 This can also be done using the currency conversion function shortcut (FX) by entering FX(DESBCM@GERMANY) in the formula bar.
Instead of manually applying functions and/or using keyboard shortcuts to create a nested function with transformations as shown in the example here, simply enter the formula in the formula bar.
Example
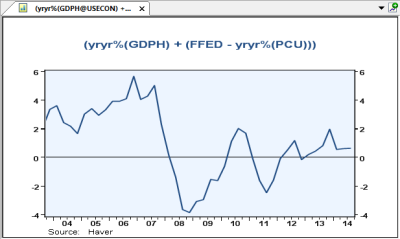
Subtracting the year-over-year change in CPI from the federal funds rate to calculate a real interest rate and then adding the growth in real GDP.
- Click the formula bar to enter the series or
 ALT + N
 - Enter the formula
- Run the command by clicking
 or
or  ENTER
ENTER - The series will be displayed in the graph area

