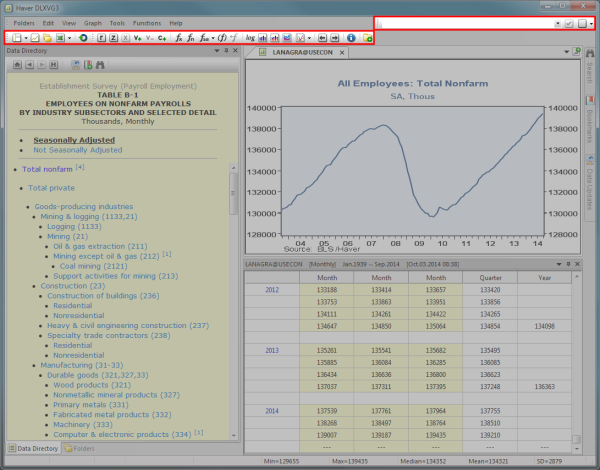
DLXVG3's workspace also contains several toolbars with various functions.
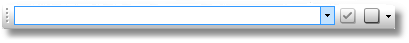
All series run through the formula bar will be saved and can be accessed via the drop-down arrow.
-
 Run Formula - processes the formula and displays it on the graph
 -
 Clear Formula - resets the formula entry
 Select the drop-down arrow on the clear button and select to erase all saved entries.
-
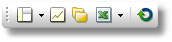
 Default View - restores the original directory/data/graph view
 -
 Classic View - maximizes the graph area to the full window size
 -
 Show Folders - toggles on/off folder mode
 -
 Excel Mode - directly select codes to enter into Excel
 -
 Reset Settings - restores the graph to its original setting

-
 Recession Shading - toggles recession shading on/off
 -
 Zoom - zooms in/out of the date span of graph data
 -
 Exchange Multiple Variables - allows you to change the order of multiple variables
 -
 Add a Variable - adds a variable to the graph
 -
 Remove a Variable - removes the bottom variable shown on the graph
 -
 Add a Constant Variable - adds a constant variable
 -
 Functions - applies a basic function to the primary series
 -
 Advanced Functions - applies an advanced function to the primary series
 -
 Seasonal Adjustment Function - applies the seasonal adjustment function to the primary series
 -
 Toggle Nesting of Functions - toggles on/off the ability to nest functions
 -
 Undo Last Function - undo previous nested function
 -
 Log Scale - toggles on/off log scale
 -
 Bar Graph - toggles on/off bar graph
 -
 Stacked Bar Graph - toggles on/off stacked bar graph
 -
 Stacked Area Graph - toggles on/off area graph
 -
 Cycle Graph - toggles on/off cycle graph
 -
 Scroll Graph (Left) - scrolls the graph to the left
 -
 Scroll Graph (Right) - scrolls the graph to the right
 -
 Series Info - displays the underlying series info of the entire graph
 -
 Save Graph in Folder - toggles on folder mode so the current graph can be saved
-
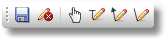
 Save Edit - saves all changes made to the graph
 -
 Cancel Edit - allows you to either discard or save all changes made to the graph
 -
 Select - selects an item on the graph
 -
 Insert Text - inserts text into the graph
 -
 Insert Arrow - inserts an arrow into the graph
 -
 Insert Line - inserts a line into the graph
This toolbar is only available in edit mode.
-
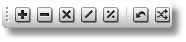
 Transformation: Add - adds the first two variables
 -
 Transformation: Subtract - subtracts the first two variables
 -
 Transformation: Multiply - multiplies the first two variables
 -
 Transformation: Divide - divides the first two variables
 -
 Transformation: Percent - computes the top series as a percent of the series below it
 -
 Transformation: Undo - undoes the last transformation
 -
 Transformation: Exchange - exchanges the first and last variables
This toolbar is only available when there are at least two variables in the active graph.